
Definitions
Value Stream
• A value stream is the sequence of steps required to satisfy a need (typically, a good or service).
• The Enterprise Value Streams Categories:
Demand (where the need for a good or service is created);
Delivery (where this need is satisfied);
Development (where this need is turned into a robust design); and,
Support (the internal processes required to allow the first three streams to effectively function).
Value Stream Mapping VSM
• The VSM is a tool used by Toyota Motor Co. to focus team efforts on specific plant waste reduction projects.
• The process involves creating a current-state map of the value stream, followed by a future-state map from which specific action plans are developed.
• VSM is a process mapping method (with standard forms, symbols, and software) used to document the current and future states for a ��value stream�� (e.g., product line or service provided)
• Goal: Identify non-value added activity and waste, and target and guide lean improvement events
• VSM is the simple process of directly observing the flows of Information and Materials as they now occur, summarizing them visually, and then envisioning a future state with much better performance��
• The ��flow�� or ��value stream�� perspective represents a shift from vertical to horizontal thinking. Horizontal thinking means looking across the traditional vertical structures of functions and departments to connect activities in the stream of value flowing from suppliers, through the organization, and on to customers.
• In other words, concentrating on overall flow means focusing on system efficiency rather than on just the point efficiency of individual elements in your organization.
• Rother and Shook provide a hands-on description of a value stream map. Simple diagrams depict the process steps (boxes), the material flow between steps (fat arrows), and information flows indicating work orders/schedules (thin arrows).
• Key data on the time each step takes and on the time between steps provide a simple means to analyze the overall process,or pathway.
TAKT Time
• Takt time (Takt is the German word for the musical term ��meter�� or ��beat��) links the requirements of the end customer to the requirements of the production system.
The idea is to synchronize the pace of production to the pace of sales.
• Using Takt times for planning purposes will only be effective if the process to make the product is reliable e.g. it demands high levels of equipment dependability, and robust supplier performance/logistics, and high levels of standardization.
• It also depends on a fundamentally different approach to the sales-production working relationship, as effective demand management as well as the management of demand become critical.
• Takt Time is the rate at which production should run to meet customer demand
• It is a preliminary measure of the value and waste.
• This takt time is mostly used as an ideal time for each operation to achieve (ideally, the cycle time for each operation should be the takt time).
• The purpose of takt time is, first and foremost, to serve as a management tool to indicate at a glance whether production is ahead or behind.
• It serves as an alignment tool:
aligning proceeding with following processes,
aligning resource requirements with demand,
aligning corporate functions with real-time production needs.
• Rather than being limited to ��repetitive production situations,�� takt time is actually most useful in helping establish flow under those very conditions when flow is especially difficult to establish or see.
• Mixed assembly line may have an Overall Takt time �C or ��Compound Takt��
• This Compound Takt may consist of many different individual product takt times.
• And those times each are determined and used to achieve Alignment with their various upstream value streams.
• The math used to determine the mixed-model takt time (the Heijunka Mixed Flow) has characteristics that are analogous in function and complexity to the TOC flow and routing calculations. (And it can be used, as Toyota uses it, for extremely complex BOM situations).
• Toyota typically reviews takt time on a monthly basis, with a ��tweaking review�� conducted every ten days. Some plants, however, may change their overall takt time very infrequently, though different models in the mix may see takt times changing frequently.
• Takt Time is calculated as
= Scheduled Runtime (Available Capacity) in Minutes per shift/Customer Demand in Units per shift
Scheduled Runtime = (Effective Minutes) - (Planned Downtime)
Effective Minutes = (minutes per shift) - (approved breaks)
Planned Downtime is the amount of time an operation is down for scheduled reasons.
Pacemaker
Most in-plant value streams can be divided into two segments: pacemaker and fabrication.
• The upstream fabrication processes respond to requirements from internal customers, and often utilize general-purpose equipment to produce a variety of components for different downstream processes.
• Pacemaker: The downstream portion of a value stream - often the final assembly process - which is dedicated to a particular product family and responds to external customers. This segment typically starts with the value-adding process that is the schedule and leveling point in a lean value stream, and involves processing steps that give the product its final form for the customer.
• The pacemaker process influences production lead time because it is the rhythm-setting point, or "heartbeat," for any value stream that utilizes pull systems.
• If the pacemaker makes large batches of one product type, or if it has significant fluctuations in production volume, then the upstream fabrication processes will have to hold more inventory in their supermarkets to be able to meet the peaks of the pacemaker's jerky component requirements.
• The efficiency of your value stream depends partly on how small you can keep the batches and volume fluctuations at the pacemaker (assembly) process.
• Many plants are now trying to link their chain of processes by establishing supermarket pull systems between processes. However, if you run significant volume fluctuations and/or large batches in assembly, then the inventory in those supermarkets will be too high. With or without pull systems, the production lead time will still be too long.
• Leveled and mixed production at the pacemaker - a steady heartbeat - helps make shorter production lead time possible. Think of the pacemaker process as the conductor of the orchestra.
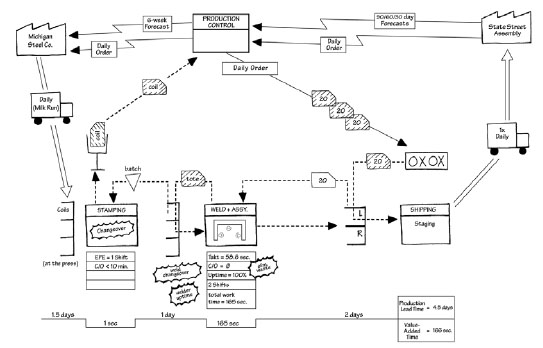
Learning To See LTS Map or a ��Process Cartoon��
• The Top Row:
The top row shows Forecast and Order Flows.
The main Control Process is shown between these.
Suppliers and customers are shown as ��factory�� pictures.
Electronic flows may be shown as zig-zags (vs. direct lines as manual flows).
• The Second Row:
The second row shows Inputs and Outputs from and to the top row.
In the diagram it includes Deliveries and Requirements numbers.
Note how already you can see differences between the Monday and Friday deliveries from suppliers and daily deliveries to customers. What if the customer sent a rush order on Tuesday and you ran out of coils of steel?
• The Third Row:
The third row shows the main process.
Around these are the Inventory triangles plus the inventory levels found (this may be a snapshot or may include a statistical distribution).
Movement arrows with bars in indicate a ��push�� (vs. white arrows which are ��pull��.
Other elements such as kanbans may also appear here.
• The Fourth Row:
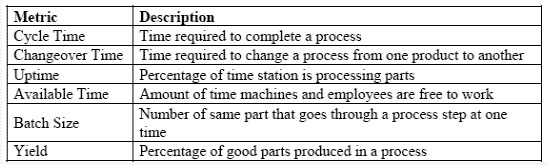
The fourth row shows timing data from each stage, with such as changeover time, cycle time and uptime.
Other data may include such as shift patterns, operating equipment effectiveness (OEE) and time available.
• The Fifth Row:
The fifth row shows Timeline for value-adding time and non-value-adding time (and hence the opportunities for improvement).
Shop stock/Kanban loop size:
1. A stock is a �� shop �C stock�� if it has 2 conditions:
Each product has a defined and clearly marked home.
The quantity of each product is set (This is the Kanban loop size)
2. A shop �C stock must present product for the customer to take, at all times.
The Kanban loop size must therefore cover demand, during replenishment considering the following 5 points:
Information flow & manufacturing lead-time.
Batching (or replacement).
Machine reliability.
Quality.
Demand variation
VSM Steps
A. Current State Map
• Step 1: Select a Product Family
Start by mapping a large-quantity and high-revenue product family.
The product family could be chosen as subject for value stream analysis due to its expected potential gain.
Identify value stream from the customer end
Product should pass through similar processes and common equipment
The analysis is limited to an intra company focus. (Door-to-door in scope within plant walls)
List products within the family
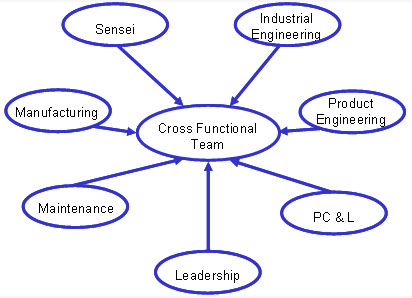
• Step 2: Form a Team
Select a cross-functional team
Select team members who are familiar with the product
Ensure that team members are trained in the use of VSM
Designate a champion (typically a line manager)
• Step 3: Understand Customer Demand
Plan for Every Part
Production Control (monthly/weekly forecasts)
Production history (day-to-day, month-to-month variation)
Sales (product changes, new business, etc.)
• Step 4: Map the Process Flow
In accordance with the ��pull�� thinking the mapping start at the shipping end and proceed upstream.
Each process on the material flow path is object of being mapped
• Step 5: Map the Material Flow
The material flow will then be mapped using appropriate icons in the rich VSM icon template.
The product will be tracked from the final operation in its routing to the raw material storage.
• Step 6: Map Information Flow
The information flow is also incorporated to provide demand information, which is an essential parameter for determining the ��pacemaker�� process in the production system.
Data Collection
Apply a standardized form for recording data from each of the identified processes in the value chain.
The current schedule Shipping/Receiving schedules Process cycle times CT
How Operations are scheduled Changeover times C/O
(push, pull, order dispatching rules ex. FIFO) Changeover frequencies
Demand rates by process (Takt Time) Number of product variations at each step
Pack sizes at each process Batch (lot) sizes
Working hours, breaks and overtime Scrap
Inventory Points (location & size) Rework
Work-in-process inventory WIP Downtime
• Step 7: Calculate Total Product Cycle Time
Draw Time-Line
After both material and information flows have been mapped, a time-line is displayed at the bottom of the map showing the processing time for each operation and the transfer delays between operations.
The time-line is used to identify the value-adding steps, as well as wastes, in the current system.
Calculate Takt-Time
Ideally, the cycle time for each operation should be the takt time
Calculate the Total Throughput Time
Calculate the total throughput time (added and non-added value time) for the current value stream
Calculate the share of value-adding time to throughput time.
• Step 8: Detail Off-Line Activities
Show on the map using general icons
Detail on another sheet using either reference VSM and/or process flow-charting
A spaghetti diagram can also created so that the transportation waste could be easily seen.
• Step 9: Identify Opportunities for Improvement
Gather Observations
When completed VSM team adds post-its with issues / observations on them; these will be addressed during any improvement activity.
Write a summary of the findings and observations of the Current State map & relevant measures
Measure Performance
It is important to measure Quality, Cost and Delivery performance of the product when mapping the current state in order that improvements can be tracked throughout the activity.
B. Future State
• After a current value stream is made, the next phase is a future value stream.
• Using the principles of lean manufacturing and a set of important questions vital to lean
manufacturing, supplied by Learning to See, a future state is drawn.
Key questions and trade offs for the future state:
1. What is the takt time?
Work at the speed of demand Takt Time (no over-production, no un-controlled over time)
Use flexible resources to react quickly if you are ahead or behind Takt Time
Process controlled through Visual Management
i.e. each process knows what is the next needs, in the correct order & amount
2. Will you build to a finished goods warehouse (Supermarket) or directly to shipping?
Protects your manufacturing operation from significant demand variation Every effort should be made to minimize these variations.
Protects your customer from significant process variation.
These variations are driven by one of the seven forms of waste and should be eliminated.
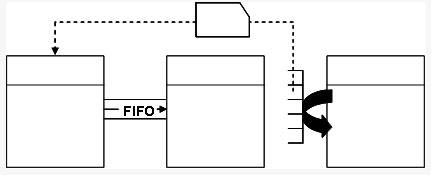
3.Where to use continuous flow (One-Piece Flow or coupled processes) processing to control production of upstream processes?
Schedule based on the Pacemaker operation
Use FIFO
Evaluate the following factors when considering this question:
Cycle Time Compatibility
Equipment Uptime/Downtime (remember that coupling can multiply the effects of downtime)
Equipment Investment
Flexibility
4. Where will you need to use supermarket pull systems to control production of upstream processes?
Where flow is not possible use inventory to buffer the problem Shop Stocks / Buffer / Supermarket/ WIP / Finished Goods / Raw Material stabilize supply to the next process
Amount of stock needed = Size of problem
The only exception would be to use a simple FIFO system.
FIFO may work in situations where only inventory quantity needs to be controlled (not sequencing, batch sizing, etc.).
Visual quantity control is needed - without physically counting parts and scheduling machine operation.
5. Where will our pacemaker be?
At what single point in the production chain will you schedule production?
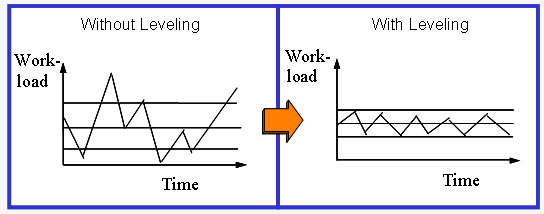
6. How will you level the production mix at the pacemaker process?
Produce different products at a uniform rate (Level the production mix)
Level the production load on the pacemaker process (Level the production volume)
Develop the capability to make ��every part every (EPE) <time period>
Leveling of the product mix must be supported by small lot production.
Small lot production must be supported by quick set-up.
An effective way of communicating the level schedule to manufacturing operations can be through the use of a load leveling box
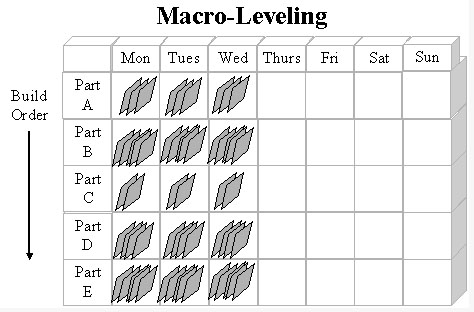
Overall Quantity Leveling
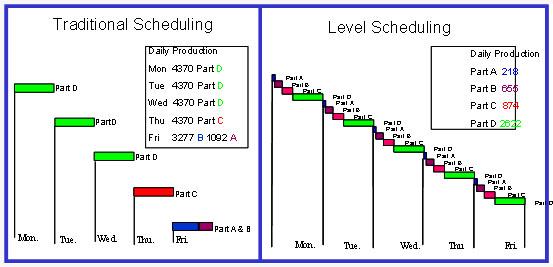
Leveling the Product Mix
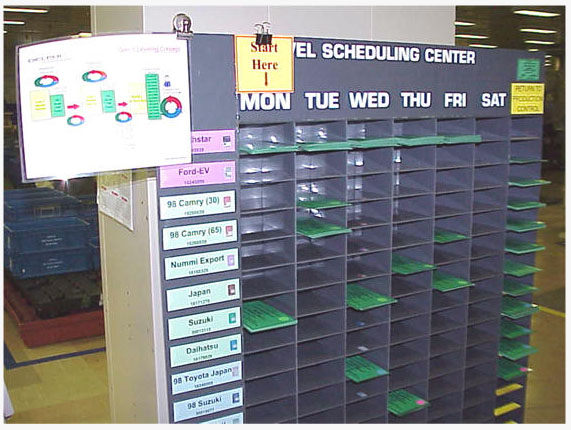
Leveling Box
7. What increment of work will you consistently release and take away at the pacemaker process?
8. What process improvements will we need to achieve our future state design?
This step is key to any successful value stream improvement activities.
Data is analyzed to determine waste (inhibitors to flow).
Identify kaizen bursts necessary to achieve the desired performance in the future state
Plans are developed to reduce or eliminate waste.
This is the step where we can most impact the bottom line.
Future Value Stream Map (Rother, 1999)
Implementation Plan
• The final step of value stream mapping is creating an Implementation Plan to help achieve the future state from the current state.
• Learning to See suggests the use of a value stream plan worksheet and a review worksheet (Rother, 1999).
• It is recommended that follow up meetings, once every week to two weeks, are necessary to continue to update and make progress on the implementation plan.
• This regular meeting format stresses the importance of the initial value stream mapping event and the actions that were identified.
• Making people accountable for certain action items will also help speed along the process.
Advantages Of Value Stream Mapping (VSM)
• Combines both ��big picture�� that enables a broad understanding and widespread communication with detailed data that enables implementable actions to be planned
• Relates the manufacturing process to supply chains, distribution channels and information flows.
• Integrates material and information flows.
• Links Production Control and Scheduling (PCS) functions such as Production Planning and Demand Forecasting to Production Scheduling and Shop floor Control using operating parameters for the manufacturing system ex. takt time (this is the production rate at which each processing stage in the manufacturing system should operate).
• Helps to unify several IE techniques for flow analysis, such as Production Flow Analysis (PFA), Business Process Reengineering (BPR), and Process Analysis and Improvement (PA&I) that, to date, have been taught and implemented in isolation.
• Provides important descriptive information for the Operation and Storage process elements that, to date has not been captured in standard Flow Process Charts used by IE��s.
• Forms the basis for implementation of Lean Manufacturing by designing the production system based on the complete dock-to-dock flow for a product family.
• Provides a company with a ��blueprint�� for strategic planning to deploy the principles of Lean Thinking for their transformation into a Lean Enterprise.
Disadvantages of Value Stream Mapping (VSM)
• Fails to handle multiple products that do not have identical maps.
• Fails to relate Transportation and Queuing delays, and changes in transfer batch sizes due to poor plant layout and/or material handling, to operating parameters (ex. machine cycle times) and measures of performance of the manufacturing system (ex. takt time)
• Lacks any worthwhile economic measure for ��value�� (ex. profit, throughput, operating costs, inventory expenses) which makes it similar to the Flow Process Charting technique used by IE��s.
• Lacks the spatial structure of the facility layout, and how that impacts inter-operation material handling delays, the sequence in which batches enter machine queues, container sizes, trip frequencies between operations, etc.
• Tends to bias a factory designer to consider only continuous flow, assembly line layouts, kanban-based Pull scheduling, etc. that are suitable mainly for HIGH volume and LOW variety manufacturing systems
• Fails to consider the allocations and utilization of an important resource �C factory floorspace �C for WIP storage, production support, material handling aisles, etc.
• Fails to show the impact on WIP, order throughput and operating expenses of in-efficient material flows in the facility ex. backtracking, criss-cross flows, non-sequential flow, large inter-operation travel distances, etc.
• Fails to handle complex BOM��s that translate into branched and multi-level Operation Process Charts and Flow Diagrams for the products.
• Fails to factor queuing delays, multi-order sequencing rules, capacity constraints, etc. into a map
• Lacks the capability, due to the manual process of creation, for rapid development and evaluation of multiple ��what if�� analyses required to prioritize different alternatives for improving a Current State Map when time and/or budget constraints exist.
» More Information 


 TPM/TQM/Value Stream Mapping


